Summary Region Analysis |
It means a spatial processing to create the aggregation map based on the line/region data. Use the grids or regions to separate the line/region features on the map, and then make statistics with standard attribute field or weight field for each grid/region unit, and the statistical results will be as the grid/region value. Finally, sort according to the grid/region value, then fill the grid/region with graduated color.
The concept of summary region is similar to the concept of point aggregation analysis. The difference is that the point aggregation analysis is calculating statistics on the point dataset, while the summary region is calculating on the line dataset and the region dataset.
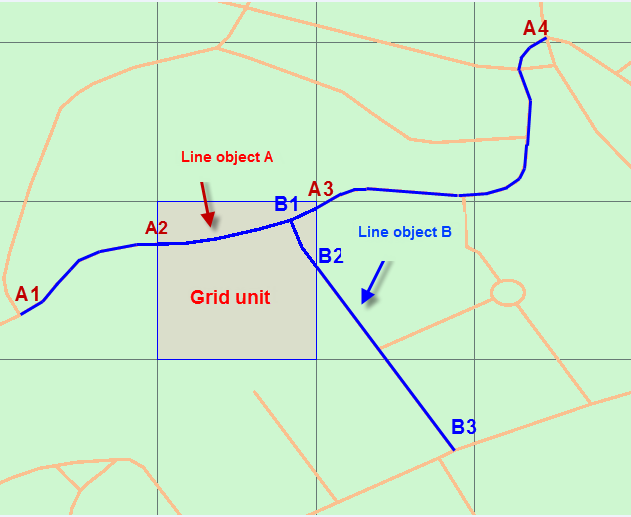
For Summarize with Grid, there are two methods to calculate the statistical value of the grid, by standard attribute field and weighted field. As shown in Figure 1, we take quadrilateral grid to calculate the statistics. The total length of line object A is from A1 to A4, but only the part from A2 to A3 is in the grid; the total length of line object B is B1 to B3, but only the part from B1 to B2 is in the grid. We take "sum" to calculate the statistics on the "length" field in the line dataset.
Use standard attribute field to calculate the statistical value: that is, the original attribute field information of the line or region objects in the grid unit is calculated.
The length value of the line object A (that is, the total length of the part from A1 to A4) is 364.11
The length value of the line object B (that is, the total length of the part from B1 to B3) is 165.01
With the "sum" statistical model, the statistical result is 364.11 + 165.01 = 529.12
Use weighted attribute field to calculate the statistical value: that is, the value is calculated from the attribute information of the intersecting part. The attribute information of the intersecting part is calculated from the weighted value of the standard attribute field.
The analysis algorithm intercepts the line object A at the A2 and A3 points, calculates the proportion of the A2A3 part in the entire line object A, through the length value of the line object A (ie, the total length of A1 to A4) 364.11, to calculate the attribute value of A2A3 is 79.70;
The analysis algorithm breaks the line object B at B2 and calculates the proportion of the B1B2 part in the entire line object B. through the length value of the line object B (ie, the total length of B1 to B3) 165.01, to calculate the attribute value of B1B2 is 31.72
With the "sum" statistical model, the statistical result is 79.70 + +31.72 = 111.42
Figure 1: Summarize with square
Source dataset: required, only supporting line/regoin dataset. The summaryregion resource page in iServer will list the datasets which meet the analysis condition.
Summarize type: required, specifies whether it is grid type or polygon type.
Range: optional, specifies which features to be processed, the default is the full map range.
Calculate statistics with the standard attribute field: that is, the original attribute field information of the line or region objects in the grid unit is calculated. Users need to choose this type or "Statistics with the weighted attribute field", that is, one of both.
Field names: Sets the field names for the standard attribute field statistics.
Statistical modes: Sets the statistical modes used for standard attribute field statistics.
Calculate statistics with the weighted attribute field : that is, the value is calculated from the attribute information of the intersecting part. The attribute information of the intersecting part is calculated from the weighted value of the standard attribute field. Users need to choose this type or "Statistics with the standard attribute field", that is, one of both.
Field names: Sets the name of the fields for the weight field.
Statistical Modes: Sets the statistical modes for weighted attribute field statistics.
Whether the length or area is for statistics: If the source dataset is a line dataset, the length of the line is counted as part of the statistical result; if the source dataset is a region dataset, the area of the statistical surface is taken as part of the statistical result.
If choosing Summarize with Grid, it also needs to set the following parameters:
Grid type: required, including square and hexagon.
Grid size: required. For square, it is the edge length; for hexagon, it is the distance from the vertex to the center of the hexagon. The default value is 10.
Grid unit: required. Optional: Meter, Kilometer, Yard, Foot, Mile (default is Meter)
If choosing Summarize with Region, it also needs to set the following parameters:
Summary region dataset: required, its type should be region dataset. Specify the region objects which need to be collected, such as administrative division regions.