
Java remote debugging technology |
JPDA (Java Platform Debugger Architecture) is an acronym for Java Platform Debugger Architecture. Through JPDA, Java developers can easily and flexibly build Java debugger. For more information about JPDA, see: Oracle JPDA guide.
With JPDA, SuperMap iServer server can open the debugging mode to facilitate the debugging of iServer DSSE extension program.
Setting the startup parameters of JVM as follows:
-Xdebug -Xrunjdwp:transport=dt_socket,server=y,suspend=y,address=49812
-Xdebug denotes that the JVM is running in DEBUG mode. -Xrunjdwp notifies the JVM to use JDWP (java debug write protocol) for running the debugging environment. The sub-parameters of Xrunjdwp are as follows:
transport: The transfer method of debugging data. dt_socket is recommended and the SOCKET mode is applicable to all the platforms.
server: Whether supports the VM of the server mode, here is y, and iServer is VM of the server mode.
suspend: Whether to perform the JVM after debugging the client connections. Here is y, iServer will be executed after connecting with the debugging client.
address: The client is used to connect with the port number of the debugging server, and here is 49812.
When running in the Tomcat container (iServer's default operating mode), you can modify catalina.bat / sh. The settings of adding JAVA_OPTS in the front are as follows:
Windows platform (catalina.bat):
set JAVA_OPTS=%JAVA_OPTS% -Xdebug -Xrunjdwp:transport=dt_socket,server=y,suspend=y,address=49812
Linux platform (catalina.sh):
JAVA_OPTS="$JAVA_OPTS -Xdebug -Xrunjdwp:transport=dt_socket,server=y,suspend=y,address=49812"
After deploying the DSSE extension application (here take GoogleMapsProvider demonstration project as an example), run startup.bat / sh and then wait for the debugger connection, as shown in the figure below: The debugger that is set up in the second step will continue to boot after the connection.
Open the DSSE extension application in Eclipse. Take GoogleMapsProvider for example, right click the project and then select Debug As> Debug Configuration:

Right click Remote Java Application, select New to create a debug configuration, as shown in the figure below:
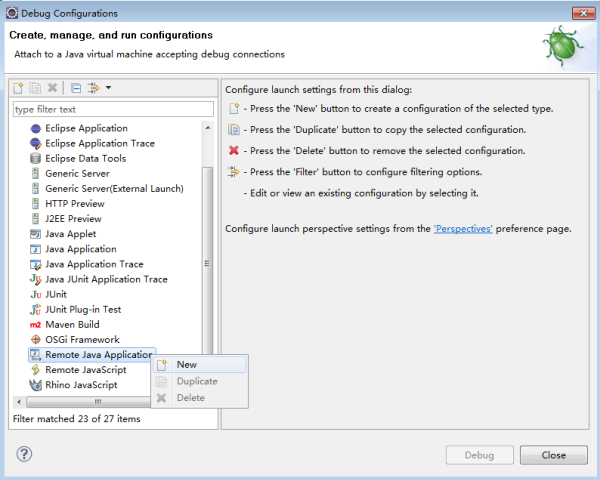
Enter Host as the server IP where the iServer in the first exists and Port as the address (i.e., the port number of the debugging server) that is set up in the first step.

Click Apply to save the configuration and click Debug for breakpoint debugging.